


Average household size was 3.5
According to the results of Address Based Population Registration System (ABPRS); in Turkey, the average household size showed a tendency to decrease. It declined from 3.7 persons in 2012 to 3.5 in 2016. When it was analyzed by provinces; the province with the highest average size of households was Şırnak with 6.7 persons in 2016. Şırnak was followed by Hakkari with 5.9 and Şanlıurfa with 5.8 persons. The province with the lowest average size of households was Çanakkale with 2.7 persons. Çanakkale was followed by Eskişehir, Balıkesir and Tunceli with 2.8 persons.
The proportion of one-family households increased
One-family (nuclear family) is defined as families comprising a couple without children, or a couple with at least one child, or a lone-parent with at least one child. Within the scope of this definition, according to the results of ABPRS; while the proportion of one-family households in our country was 67.4% in 2014, this proportion was 66.4% in 2016. While the proportion of one-family households was 13.9% in 2014, it was observed that this proportion increased to 14.9% in 2016.
As the proportion of extended family households which cover multi-family households or at least one nuclear family with non-family member(s) was 16.7% in 2014, this proportion was 16.3% in 2016. It was observed that while the proportion of multi-person households without nuclear families was 2.1% in 2014, it increased to 2.4% in 2016.
Proportion of households by type, 2014-2016

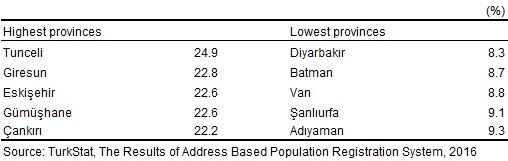
Tunceli had the highest proportion of one-person households
The province which had the highest proportion of one-person households was Tunceli with 24.9% in 2016. This province was followed by Giresun with 22.8% and Eskişehir and Gümüşhane with 22.6%, respectively. The province which had the lowest proportion of one-person households was Diyarbakır with 8.3%. This province was followed by Batman with 8.7% and Van with 8.8%, respectively.
The proportions of one-person households by first 5 provinces, 2016
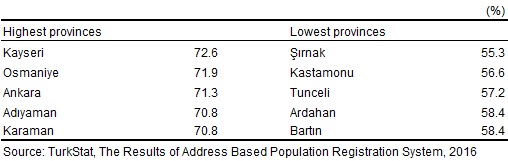
Kayseri had the highest proportion of one-family households
The province which had the highest proportion of one-family households was Kayseri with 72.6% in 2016. Kayseri was followed by Osmaniye with 71.9% and by Ankara with 71.3%. The province which had the lowest proportion of one-family households was Şırnak with 55.3%. This province was followed by Kastamonu with 56.6% and Tunceli with 57.2%.
The proportions of one-family households by first 5 provinces, 2016
Lone-parent with at least one child families constituted 8.2% of households
The proportion of lone-parent with at least one child families in total households was 8.2% in Turkey in 2016. When it was analyzed in more detail, 1.7% of total households were lone-father with at least one child families, 6.5% was lone-mother with at least one child families.
İzmir had the highest proportion of lone-parent with resident children families
The provinces with the highest proportion of lone-parent with at least one child families were in İzmir with 10%, Adana with 9.8% and Malatya with 9.7%, the provinces with the lowest proportion were in Bayburt with 5.8%, Tokat with 5.9% and Bitlis, Nevşehir, Burdur and Yozgat with 6.2% in 2016.
The provinces with the highest proportion of lone mothers with at least one resident child were İzmir with 7.9%, Adana with 7.8% and Bingöl and Hatay with 7.7%, the provinces with the lowest proportion were Bayburt with 4.5%, Ardahan with 4.6% and Tokat with 4.7%. The provinces with the highest proportion of lone fathers with at least one resident child were Malatya with 2.6%, Gümüşhane with 2.5% and Iğdır and Kilis with 2.4%, the provinces with the lowest proportion were Nevşehir, Kayseri and Tokat with 1.2%.
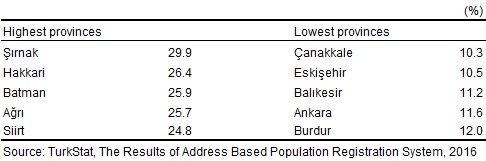
Şırnak had the highest proportion of extended family households
The province which had the highest proportion of extended family households was Şırnak with 29.9% in 2016. This province was followed by Hakkari with 26.4% and Batman with 25.9%. The province which had the lowest proportion of extended family households was Çanakkale with 10.3%. This province was followed by Eskişehir with 10.5% and Balıkesir with 11.2%.
The proportions of extended family households by first 5 provinces, 2016
Females didn’t complete their education mostly for the reason of their families’ not allowing
According to the results of family structure survey, 2016; the proportion of the individuals aged 15 and over, who didn’t complete education even though they wanted to continue, was 18.3%. When the reasons for the individuals who didn’t complete education was analyzed; it was seen that the first reason was economic reasons with 45.5%, the second one was the family’s not allowing with 22.7% and the third one was failure in education with 12.3%.
When the reasons for the individuals who didn’t complete education was analyzed by sex; it was observed that while males didn’t complete their education mostly for the reasons of economic reasons with 58.7%, failure in education with 16.6% and the family’s not allowing with 7.5%, females didn’t complete their education mostly for the reasons of the family’s not allowing with 38.1%, economic reasons with 32.3% and getting married/engaged/becoming mother/being pregnant with 9.5%.
Individuals met with their spouses by family and relative network mostly
According to the results of family structure survey, 2016; when the social networks where the individuals aged 15 and over and who had experienced marriage, met with their spouses was examined; it was seen that 49.8% of the individuals met their spouses by family and relative network, 28.2% met their spouses by neighborhood network, 10.3% met by friends network (outside school and work) throughout the country. When how individuals met their spouses was analyzed by sex; it was seen that 47.8% of males and 51.5% of females met with their spouses by family and relative network.
23.2% of the individuals stated that they were relative with their spouses
According to the results of family structure survey, 2016; when it was examined whether the individuals who were aged 15 and over and had experienced marriage were related to their spouses; it was observed that 23.2% of the individuals were relative with their spouses.
According to Statistical Regions (SR) Level 1; the region which had the most common consanguineous marriage was TRC South East Anatolia (Gaziantep, Adıyaman, Kilis, Şanlıurfa, Diyarbakır, Mardin, Batman, Şırnak, Siirt) with 42.6%. The region which had the lowest observation on consanguineous marriage was TR2 West Marmara (Tekirdağ, Edirne, Kırklareli, Balıkesir, Çanakkale) with 8.9%.
Females were decision maker on house layout while males were on holiday and entertainment
According to the results of family structure survey, 2016; when the decision makers on some selected issues for individuals aged 15 and over living in household was analyzed by sex; it was seen that females had decision making priority on house layout with 78.1%, shopping with 58% and relations with neighbors with 56.1%, respectively. Males were decision maker on holiday and entertainment with 70.6%, house selection with 65.9% and relations with relatives with 59.7%.
Females spent 5 times more time than males on household and family care
According to the results of time use survey, 2014-2015; when the time spent on household and family care activities by individuals aged 15 and over was examined; it was seen that the average time for this activity was 2 hours 45 minutes per day. While males spent 53 minutes, females spent 4 hours 35 minutes for this activity. When the time spent on household and family care was analyzed by employment status; it was seen that while employed individuals aged 15 and over spent 1 hour 34 minutes, non-employed individuals spent 3 hours 47 minutes per day on average.
When the time spent on household and family care was analyzed by employment status and sex; it was seen that while employed males spent 46 minutes, employed females spent 3 hours 31 minutes per day on average. For household and family care activities, non-employed males spent 1 hour 7 minutes and non-employed females spent 4 hours 59 minutes.
14.5% of time allocated to household and family care was spent on child care
According to the results of time use survey, 2014-2015; when time distribution in household and family care for the individuals aged 15 and over was examined, it was seen that 14.5% of this time was allocated to child care. While males allocated 17.2% to child care of total time spent to household and family care, females allocated 14.1% to child care.
Istanbul had the highest number of foster parents
According to Ministry of Family and Social Policy’s data; throughout Turkey by the date of 8 May 2017, number of foster parents was 4 thousand 242. Examining the number of foster parents by province, it was seen that Istanbul had the highest number with 386 foster parents. Istanbul was followed by İzmir with 310, Ankara with 254, Kayseri with 160 and Kocaeli with 140 foster parents, respectively.
53.5% of the individuals didn’t want to be foster parent
According to the results of family structure survey, 2016; when individuals aged 15 and over were asked whether they wanted to be foster parent or not, 30.4% of them stated that they wanted to be a foster parent, 53.5% of them did not want to be a foster parent and 16.1% of them did not have any information about it. The proportion of males who wanted to be a foster parent was 28.2% and the proportion of women was 32.6%.
When the proportion of willingness to be a foster parent was examined by SR Level 1; the region with the highest proportion of individuals who stated that they wanted to be a foster parent was TR9 East Black Sea (Trabzon, Ordu, Giresun, Rize, Artvin, Gümüşhane) with 42.4% and the region with the lowest proportion was TRC Southeast Anatolia with 17.2%.
Relatives and neighborhood were visited mostly for exchanging greetings in religious holidays
According to the results of family structure survey, 2016; when individuals’ aged 15 and over frequencies of visits to relatives and neighborhood in special situations were examined, it was seen that they visited their relatives and neighborhood mostly for exchanging greetings in religious holidays with 65.4%.
It was seen that exchanging greetings in religious holidays was followed by to give condolences with 61.6%, to ceremonies and celebrations such as wedding with 59.3%, visiting patients with 56.7%, to see the new born baby of acquaintance with 49.5%, visiting graves with 47.5%, to bid farewell and to greet an acquaintance for military service with 46.9%, upon their return from pilgrimage with 46.8% and to celebrate the newly purchased home of acquaintance with 45.9%, respectively.
Families made individuals happiest
According to the results of life satisfaction survey, the proportion of the individuals aged 18 and over who stated that their families made them happiest was 70.2% in 2016. While the proportion of males who mentioned that their families made them happiest was 76.3%, this proportion was 64.3% for females.
74.4% of the individuals stated that their families were happy
According to the results of family structure survey, 2016; when having been examined how the individuals aged 15 and over assessed their families’ general level of happiness, 74.4% of them stated that their families were happy, 20% of them stated that their families’ general level of happiness was neither happy nor unhappy and 5.7% of them stated that their families were unhappy.
SR Level 1, the region with the highest proportion of individuals who stated that their families were happy was TR7 Central Anatolia (Kırıkkale, Aksaray, Niğde, Nevşehir, Kırşehir, Kayseri, Sivas, Yozgat) with 81.1% and the region with the lowest proportion was TRC Southeast Anatolia with 64.9%.
Having fixed line telephone decreased as having mobile phone increased
According to the results of information and communication technology usage survey in households and by individuals; when the availability of devices in households was examined; it was seen that while the proportion of availability of desktop computers in households was 10% in 2004, it increased to 34.3% in 2011. This proportion showed tendency to decrease in the following years and was 22.9% in 2016.
While the proportion of availability of portable computer (laptop, tablet, netbook, etc.) in households was 0.9% in 2004, this proportion showed tendency to increase in the following years and was 49% in 2016. It was seen that while the proportion of availability of mobile phone (including smart phone) in households was 53.7% in 2004, it increased to 96.9% in 2016, as the proportion of availability of fixed line telephone was 81.6% in 2004, it was seen that this proportion decreased to 25.6% in 2016.
When the proportion of access to the Internet in households analyzed, it was seen that while this proportion was 7% in 2004, it was 76.3% in 2016.
21.9% of the individuals were below the poverty threshold
According to the results of income and living conditions survey; when at risk of poverty threshold was examined by taken equalized household disposable income criteria 60% into consideration, it was seen that the proportion of the individuals who lived below the poverty threshold was 21.9% in 2015. When the proportion of poverty by household types was analyzed; it was observed that 29.3% of households with one adult with at least one dependent children lived below the relative poverty threshold.
Dependent child is defined as a child who is under the age of 18 or in the age group of 18-24, economically inactive and living with at least one parent. While the poverty rate of households having dependent children was 26.7%, it was 7.9% for the households having no dependent children.
The most important housing problem was inability of heating the dwelling due to isolation
According to the results of income and living conditions survey; when the ownership status of dwelling was examined; it was seen that 60.4% of the individuals were owner and 23.3% were tenant in their residence.
It was observed that 43% of individuals faced with problems about heating their dwelling due to isolation, 39% of individuals faced with problems about leaking roof, damp walls, floors or foundation, or rot in window frames of floor and 24.2% of them faced with pollution, grime due to traffic/industry or other environmental problems in 2015.
Legal Notice: The information in this article is intended for information purposes only. It is not intended for professional information purposes specific to a person or an institution. Every institution has different requirements because of its own circumstances even though they bear a resemblance to each other. Consequently, it is your interest to consult on an expert before taking a decision based on information stated in this article and putting into practice. Neither MuhasebeNews nor related person or institutions are not responsible for any damages or losses that might occur in consequence of the use of the information in this article by private or formal, real or legal person and institutions.


