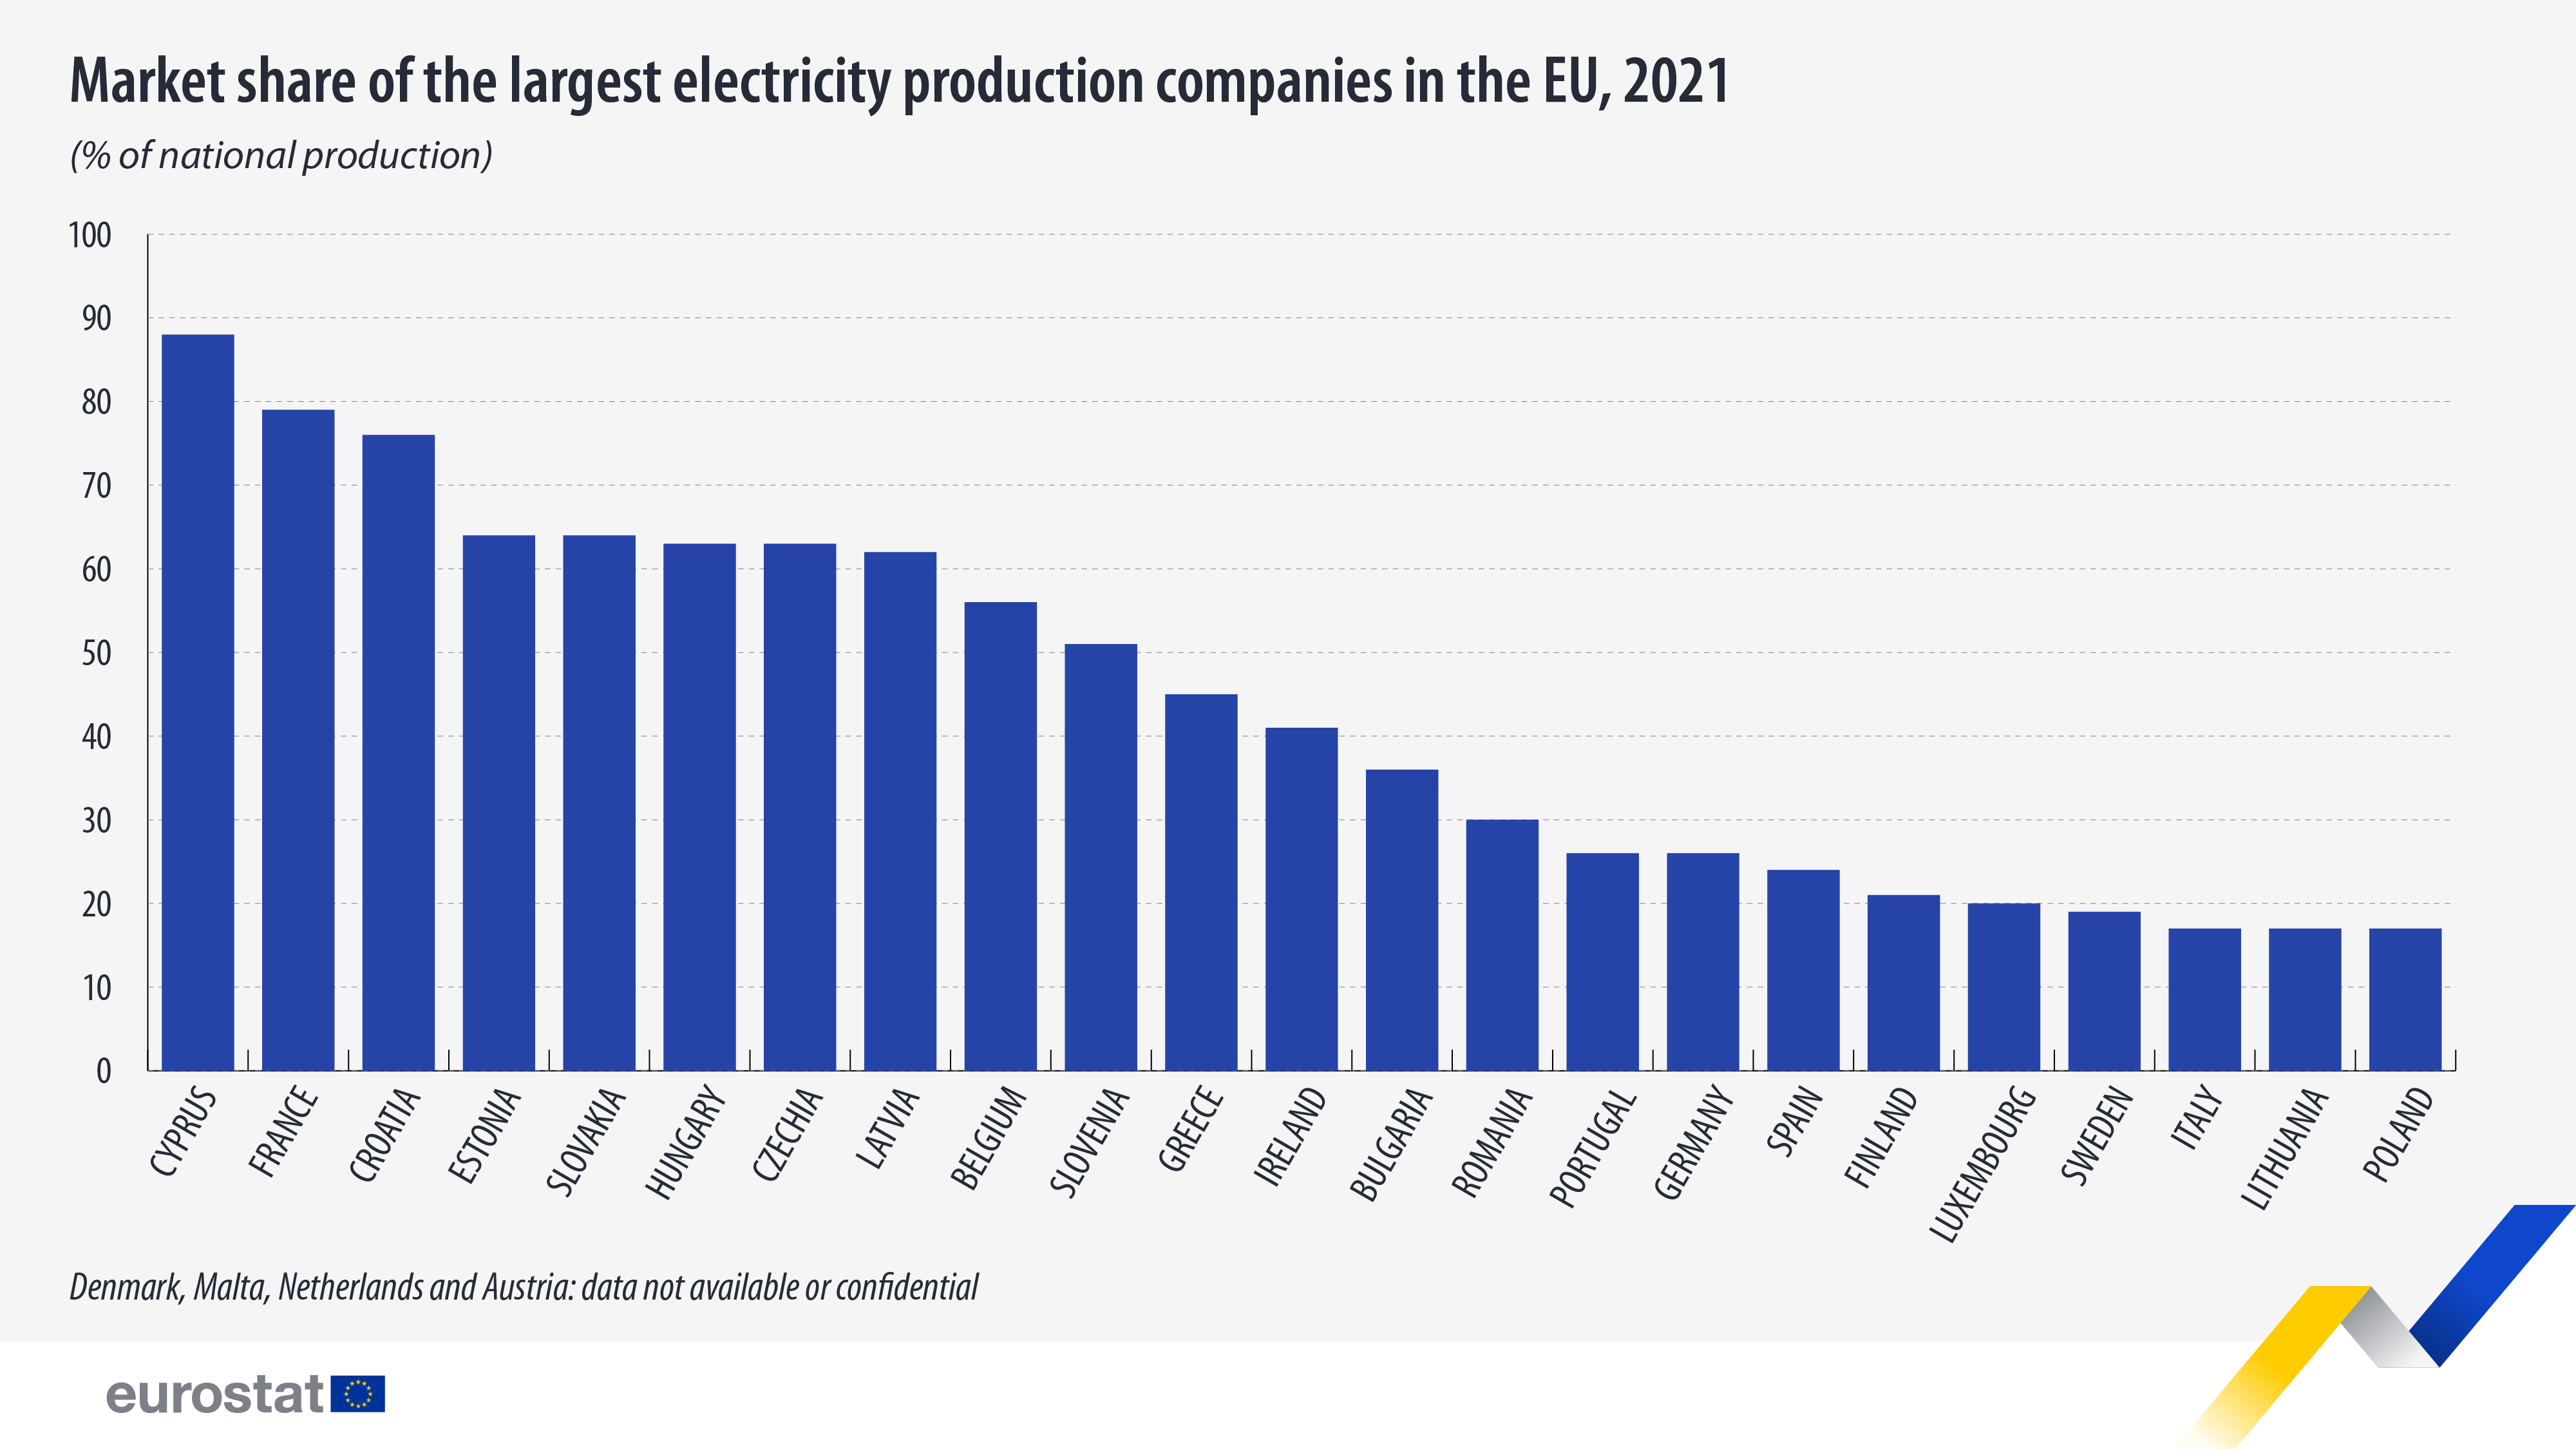
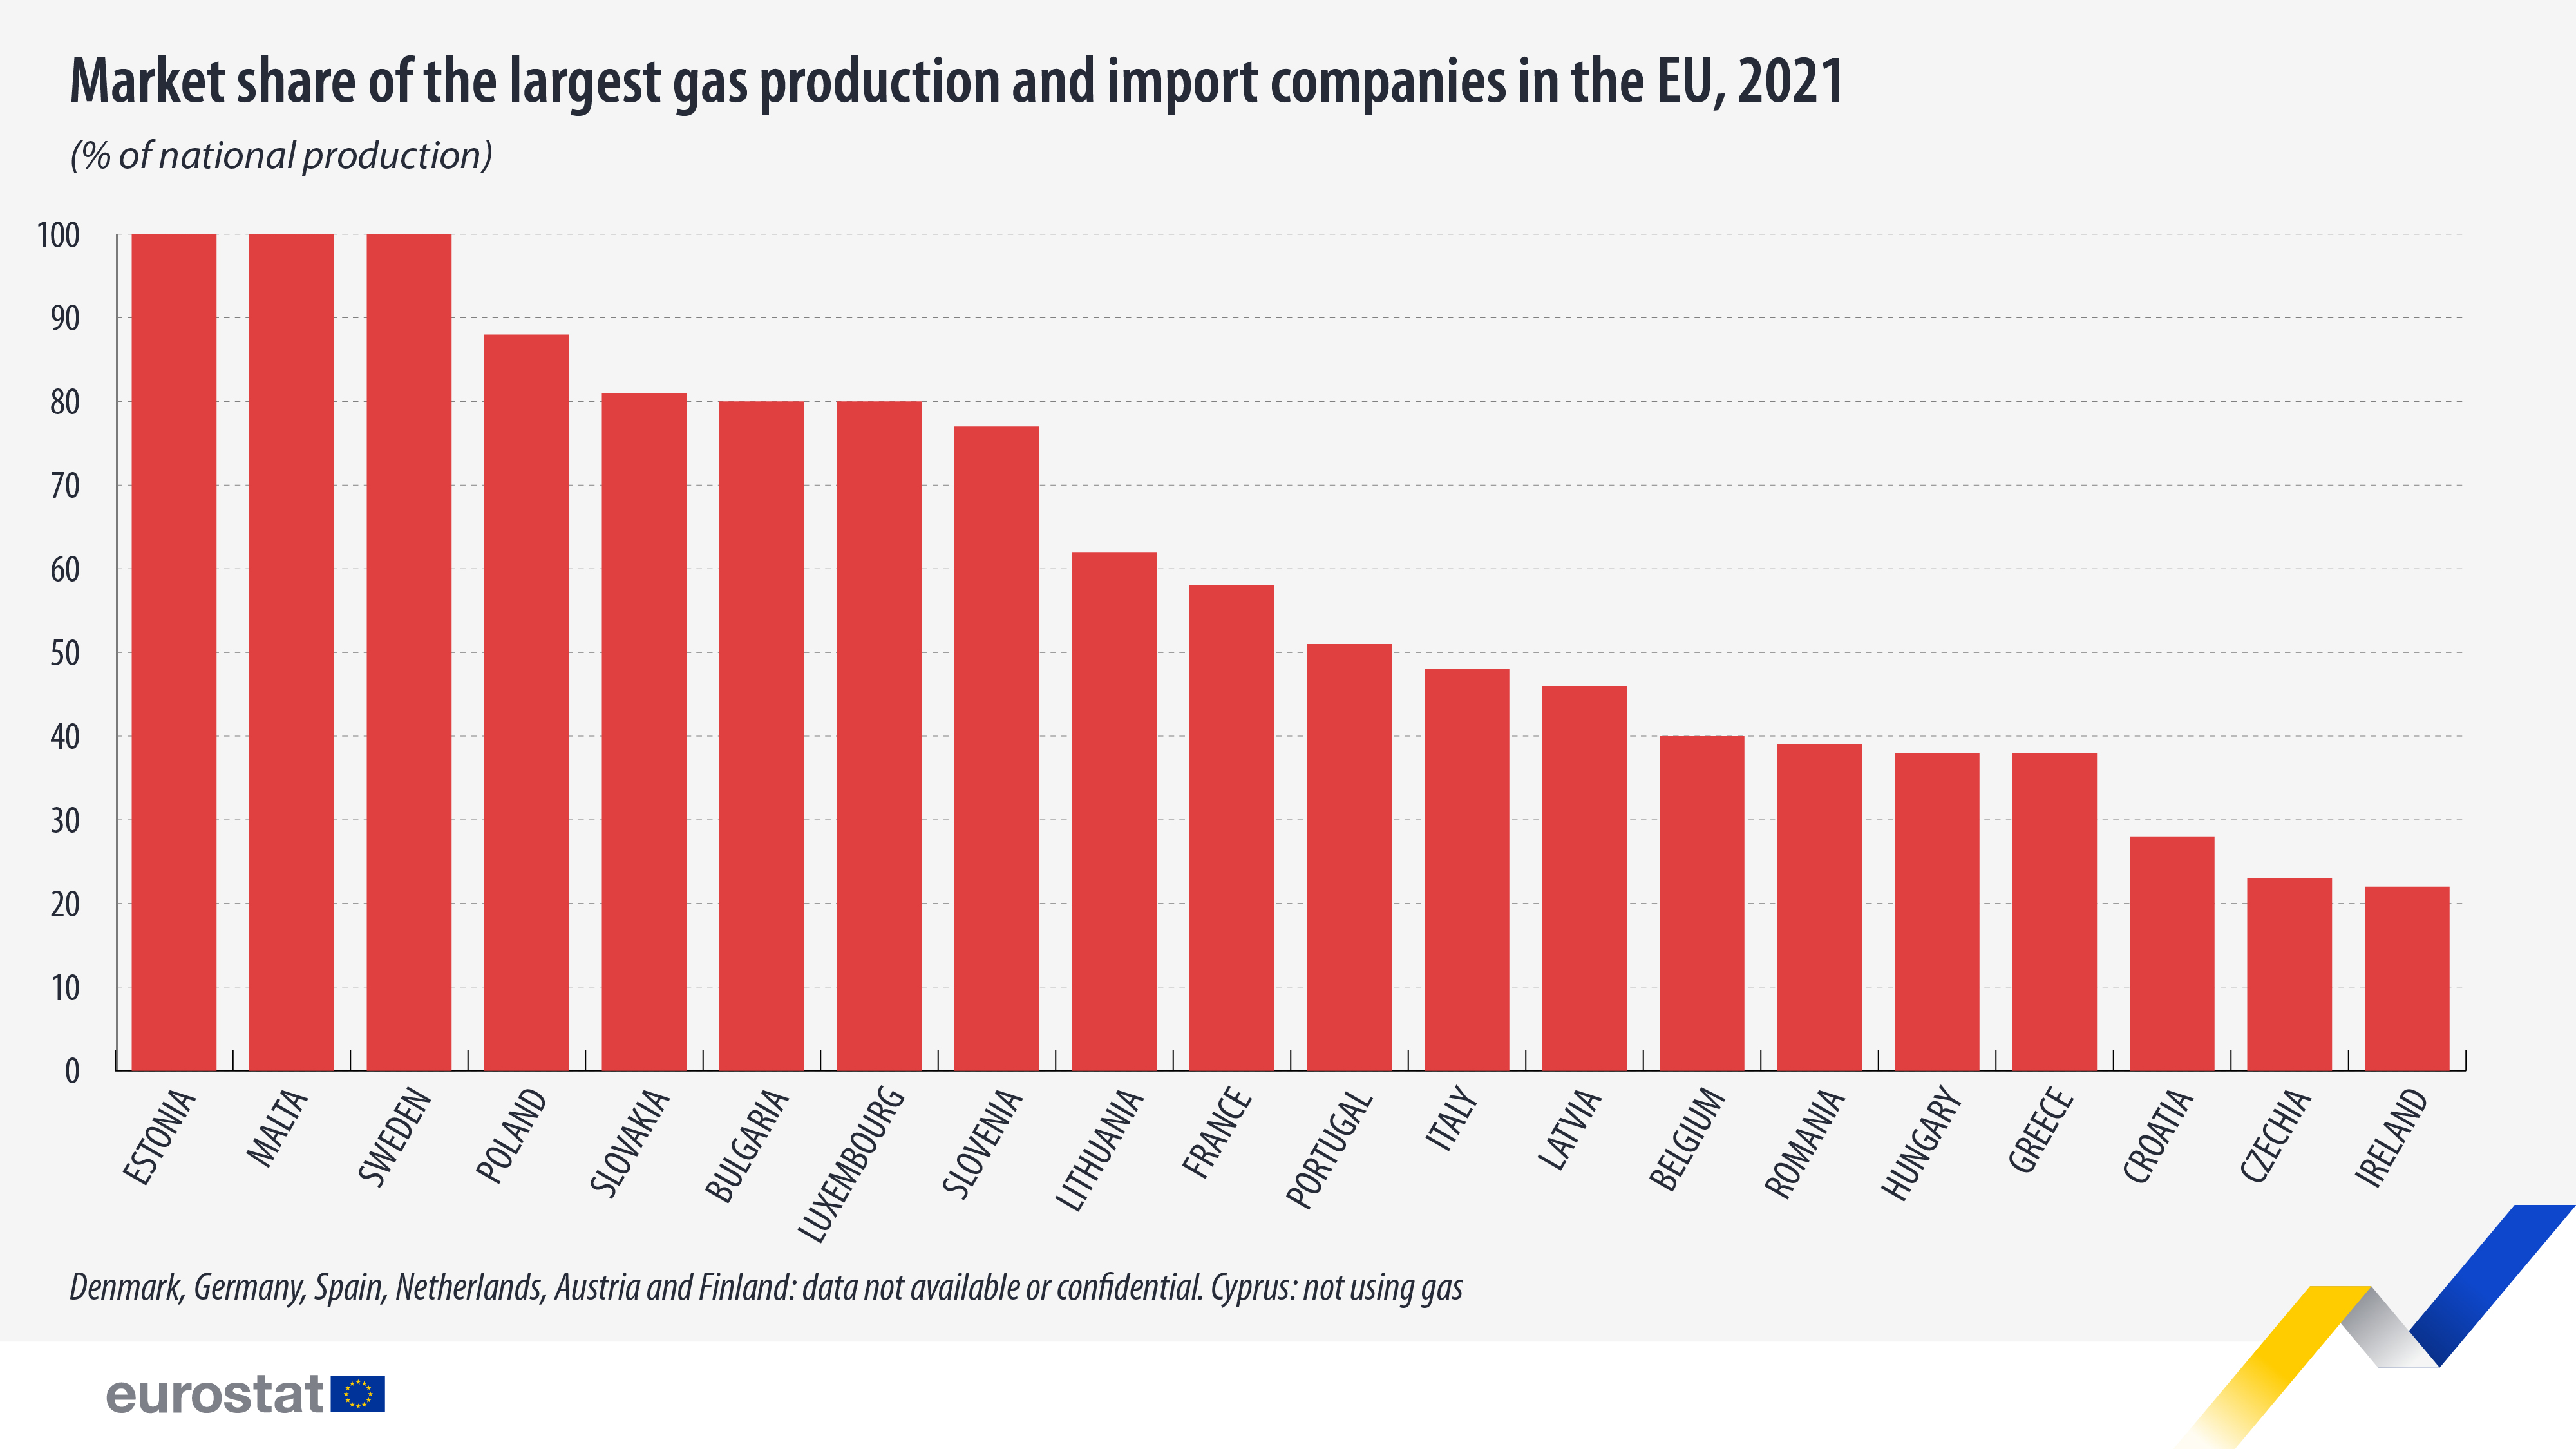
The market shares of the largest electricity and gas producers in the EU have been decreasing in most countries since 2013 when Eurostat started collecting this data.
A market share indicator describes how much energy the largest company of the network serves in one market. Larger market shares indicate a monopolistic or oligopolistic market.
In 2021, the market share of the largest electricity producer in the electricity market varied across EU countries. The highest share was recorded in Cyprus (88%), followed by France (79%), Croatia (76%) and Estonia (64%).
At the other end of the scale, the market share of the largest producer in the electricity market was less than 20% in four EU members: Poland, Lithuania, and Italy (all 17%) and Sweden (19%).
On a year-to-year basis, from 2020 to 2021, the largest market share increase was reported in Ireland (32%), while the largest decrease was in Portugal (-32%). Share increase indicates a rise in market concentration, for example after a merger of large market participants. On the opposite, a share decrease shows a reduction of market concentration. Of the other EU countries, 15 reported a change from 2020 to 2021 that is below 10%.
Compared with 2013, the 2021 market share of the largest producer in the electricity market was lower in most EU countries. The decline in the market share ranged from -39 percentage points (pp) in Luxembourg (following the liberalisation of the electricity market) and -20 pp in Slovakia to -1 pp in Bulgaria and -4 pp in Finland. In contrast, the share remained stable in Sweden (19%) and Poland (17%), while it increased in Hungary (+10 pp), Romania (+3 pp) and Spain (+2 pp).
Natural gas import and production: market share of largest company decreased in 14 EU countries
For natural gas imports and production, the largest market share was 100% in Estonia, Malta, and Sweden, where only one entity dominated national production and imports. In 2021, the gross available energy from natural gas was only 2.3% of the total in Sweden. Malta is a small market, so it is expected that one entity could cover market needs.
By contrast, the largest natural gas import and production company had the lowest level of market penetration in Ireland (22%) and Czechia (23%).
On a year-to-year basis, from 2020 to 2021, the largest market share decrease was reported in Croatia (-45%) and in Czechia (-38%). The number of main companies that import or produce natural gas for the local market increased from 5 to 6 in Czechia and from 3 to 5 in Croatia.
Compared with 2013, the market share of the largest natural gas import and production company decreased in 14 EU members with available data in 2021. The largest decreases were recorded in Greece (-61 pp), Latvia (-54 pp) and Czechia (-46 pp).
Meanwhile, the share remained the same in Sweden (at 100%), whereas it increased in four EU members: Lithuania (+22 pp), Estonia (+16 pp), Slovakia (+13 pp) and Belgium (+7 pp).
Source: Eurostat
Legal Notice: The information in this article is intended for information purposes only. It is not intended for professional information purposes specific to a person or an institution. Every institution has different requirements because of its own circumstances even though they bear a resemblance to each other. Consequently, it is your interest to consult on an expert before taking a decision based on information stated in this article and putting into practice. Neither MuhasebeNews nor related person or institutions are not responsible for any damages or losses that might occur in consequence of the use of the information in this article by private or formal, real or legal person and institutions.


