


Gross Domestic Product (GDP) increased by 2.9% in 2016
The first estimate of Gross Domestic Product by production approach, with chain linked volume index, increased by 2.9% in 2016 compared to the previous year
Among the activities that constitute gross domestic product; the total value added of the activities constituting the agricultural sector decreased by 4.1% in 2016 compared with the previous year in the chained linked volume index, the total value added of the activities constituting the industry sector increased by 4.5%, the total value added of the activities constituting the construction sector increased by 7.2% and the total value added of the activities constituting the service sector decreased by 0.8%.
Gross Domestic Product Per Capita was 32 676 TRY in 2016
The gross domestic product per capita in 2016 was 32 676 TRY and 10 807 US Dollars at current prices.
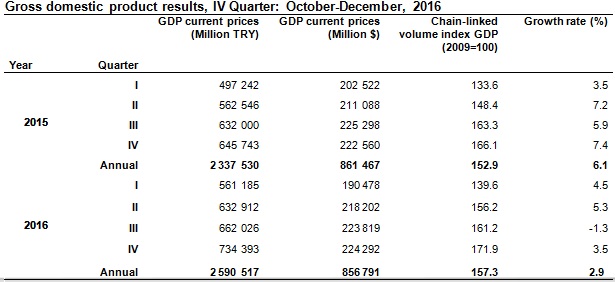
Gross Domestic Product (GDP) in the fourth quarter increased by 3.5% in the chain linked volume index
Gross domestic product increased by 3.5% compared to the same quarter of previous year in the fourth quarter of 2016.
Gross domestic product with production method was 734 billion 393 million TRY at current prices. Among the activities that constitute gross domestic product; the total value added of the activities constituting the agricultural sector increased by 1.3% in the fourth quarter of 2016 compared with the same quarter of the previous year in the chained linked volume index, the total value added of the activities constituting the industry sector increased by 5.0%, the total value added of the activities constituting the construction sector increased by 3.7% and the total value added of the activities constituting the service sector increased by 1.8%.
Calendar adjusted gross domestic product in the fourth quarter of 2016 increased by 3.5% compared to the same quarter of previous year. Seasonally and calendar adjusted GDP increased by 3.8% compared to the previous quarter.
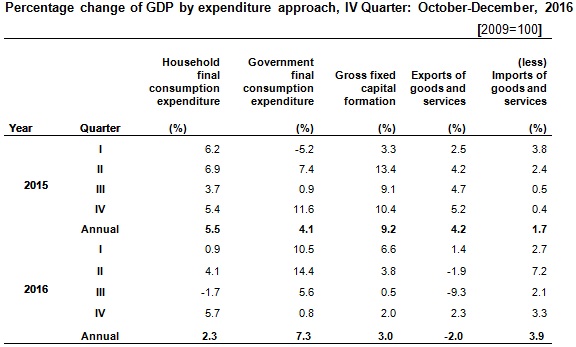
Final consumption expenditures of households at chained volume measure increased by 2.3% in 2016.
Final consumption expenditures of households increased by 2.3% in 2016 compared to the previous year’s chain linked volume index. The share of household consumption expenditures in GDP was 59.5%.
In 2016, the share of government final consumption expenditures in GDP was 14.7%, while the share of fixed capital formation was 29.8%. According to the previous year’s chain linked volume index, final consumption expenditure by the government increased by 7.3% and gross fixed capital formation by 3%.
Household final consumption expenditure increased by 5.7% in the fourth quarter.
Household final consumption expenditure increased by 5.7% in the fourth quarter compared with the same quarter of the previous year in the chained linked volume index, government final consumption expenditure increased by 0.8% and gross fixed capital formation increased by 2%.
Exports of goods and services decreased by 2%, imports increased by 3.9% in 2016.
In 2016, exports of goods and services decreased by 2%, while imports increased by 3.9% compared to the previous year’s chain-volume index. Exports of goods and services increased by 2.3% in the fourth quarter compared with the same quarter of the previous year in the chained linked volume index, imports of goods and services increased by 3.3%.
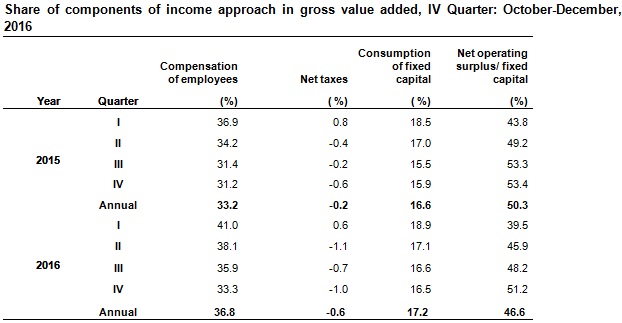
 Compensation of employees increased by 22.8% in 2016.
Compensation of employees increased by 22.8% while Net operating Surplus/Mixed income increased by 2.6% in 2016.
Compensation of employees increased by 19.7% in the fourth quarter.
Compensation of employees increased by 19.7% while Net operating Surplus/Mixed income increased by 7.7% in the fourth quarter with respect to same quarter of previous year.
The share of compensation of employees in gross value added was 33.3%
The share of compensation of employees in the gross value added was 33.3% in the fourth quarter of 2016 while it was 31.2% in the same quarter of previous year. The share of net operating surplus/mixed income was 51.2% while it was 53.4% in the same quarter of previous year.
 Legal Notice: The information in this article is intended for information purposes only. It is not intended for professional information purposes specific to a person or an institution. Every institution has different requirements because of its own circumstances even though they bear a resemblance to each other. Consequently, it is your interest to consult on an expert before taking a decision based on information stated in this article and putting into practice. Neither MuhasebeNews nor related person or institutions are not responsible for any damages or losses that might occur in consequence of the use of the information in this article by private or formal, real or legal person and institutions.


