


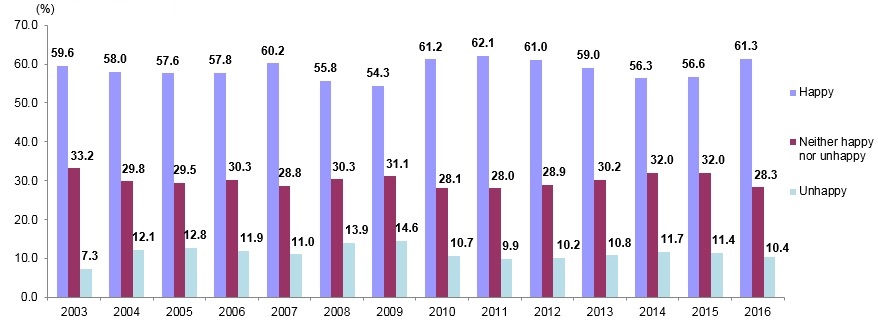
The percentage of individuals who mentioned that they were happy was 61.3%
While 56.6% of individuals mentioned that they were happy in 2015, the percentage increased to 61.3% in 2016. While 11.4% of individuals mentioned that they were unhappy in 2015, the percentage decreased to 10.4% in 2016.
While the level of happiness was 60.2% for females in 2015, the percentage increased to 64.5% in 2016, the level of happiness for males increased to 58.1% from 52.9%.
When the level of happiness was analyzed by age groups, the highest level of happiness was at 18-24 age group with 65.1%, the lowest level of happiness was seen at 35-44 age group with 58.2% in 2016.
Level of happiness in general, 2003-2016
People who didn’t complete school have higher level of happiness
While the happiness percentage was 63.5% for individuals who did not complete school, it was followed by primary school graduates with 62.9%, primary education or junior high school gradutes with 61.4%, higher education graduates with 60.2%, high school and equivalent graduates with 57.8%, respectively.
Married females were happier than married males
It was seen that married individuals were happier than unmarried individuals. While 64.7% of married individuals were happy, the percentage was 53.5% for unmarried ones in 2016. When the level of happiness was analyzed by sex, it was seen that 68.3% of married females and 60.8% of married males were happy.
Families were the ones that made individuals happiest
While the percentage of individuals who mentioned that their families made them happiest was 70.2%; children with 15.1%, spouse with 4.7%, parents with 3.6%, themselves with 2.7%, grandchildren with 1.9% and others with 1.7% were followed, respectively.
Health was the first source of happiness
While the percentage of individuals who mentioned that their health made them happiest was 72.1%; love with 14.6%, success with 7%, money with 3.2%, work with 2.3% and other values with 0.8% were followed, respectively.
Satisfaction level from public services in general increased
When we look at the overall satisfaction level of individuals, according to the results, it was observed that the highest increase occurred in services of Social Security Institution with 9.2 percentage points in 2016. The highest satisfaction level was seen in the transportation services with 78.4%. It was followed with public security services with 75.7%, health services with 75.4%, Social Security Institution services with 67.9%, education services with 65.1% and judicial services with 57.9%, respectively in 2016.
76.8% of the individuals were hopeful about their own future
While the percentage of individuals who were hopeful about their own future was 74.4% in 2015, the percentage increased to 76.8% in 2016. While the percentage of females who were hopeful about their own future was 74% in 2015, the percentage increased to 76.7% in 2016. While the percentage of males who were hopeful about their own future was 74.7% in 2015, the percentage increased to 77% in 2016.
Legal Notice: The information in this article is intended for information purposes only. It is not intended for professional information purposes specific to a person or an institution. Every institution has different requirements because of its own circumstances even though they bear a resemblance to each other. Consequently, it is your interest to consult on an expert before taking a decision based on information stated in this article and putting into practice. Neither MuhasebeNews nor related person or institutions are not responsible for any damages or losses that might occur in consequence of the use of the information in this article by private or formal, real or legal person and institutions.


