


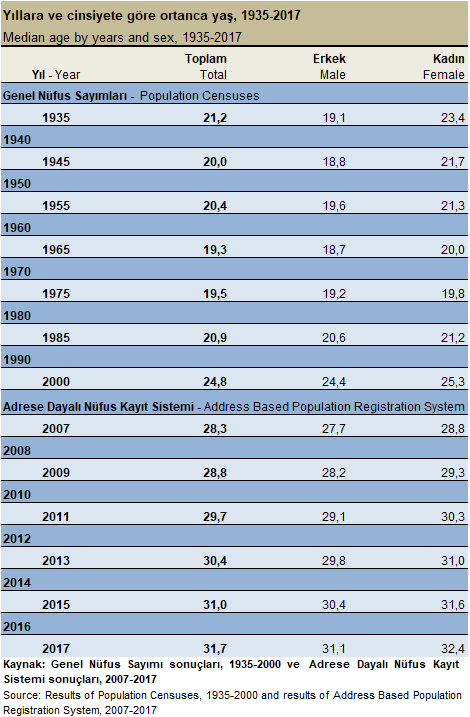
Median age by years and sex, 1935-2017
According to the list regarding median age by years and sex:
- In 1935, %19,1 of male population and %23,4 of female population compose %21,2 of median age population.
- In 1975, %19,2 of male population and %19,8 of female population compose %19,5 of median age population.
- In 2000, %24,4 of male population and % 25,3 female population compose 24,8 of median age population.
- In 2017, %31,1 of male population and % 32,4 female population compose 31,7 of median age population.
______________________________________________________________________
Source: TSI
Legal Notice: The information in this article is intended for information purposes only. It is not intended for professional information purposes specific to a person or an institution. Every institution has different requirements because of its own circumstances even though they bear a resemblance to each other. Consequently, it is your interest to consult on an expert before taking a decision based on information stated in this article and putting into practice. Neither MuhasebeNews nor related person or institutions are not responsible for any damages or losses that might occur in consequence of the use of the information in this article by private or formal, real or legal person and institutions.


